


Portfolio
University of West Florida GIS students apply cutting edge data modeling and visualization technologies to interpret location-based data and design solutions to address real world issues. The UWF GeoData Center routinely partners with area organizations to utilize data and mapping expertise that makes an impact across the region and in our local community.
GeoData Center Data Hub
Explore the GeoData Center Data Hub to dive into a range of innovative UWF GIS Center and student projects that showcase the power of GIS technology in solving real-world problems. Whether you're a researcher, student or GIS enthusiast, you'll find valuable insights and inspiration. Stay updated UWF's latest GIS research.
View More GeoData Center Projects

Argos’ Edible Campus: GIS for Food Security
Argos’ Edible Campus, a student-led initiative at the University of West Florida uses GIS technology to support food security and sustainability. The project maps edible fruit, nut, and vegetable-producing plants across campus, providing free, accessible food to the UWF community. Using ArcGIS data collection tools and a custom dashboard, the team created an interactive harvest map to track plant locations, seasonal availability, and key attributes. The initiative is part of a broader effort that includes the UWF Community Garden and Argo Pantry, combining spatial analysis with environmental stewardship and social impact.
Student Capstone Project: Detecting Wildfires with Deep Learning and Satellite Imagery: The California Wildfire GeoImaging Dataset
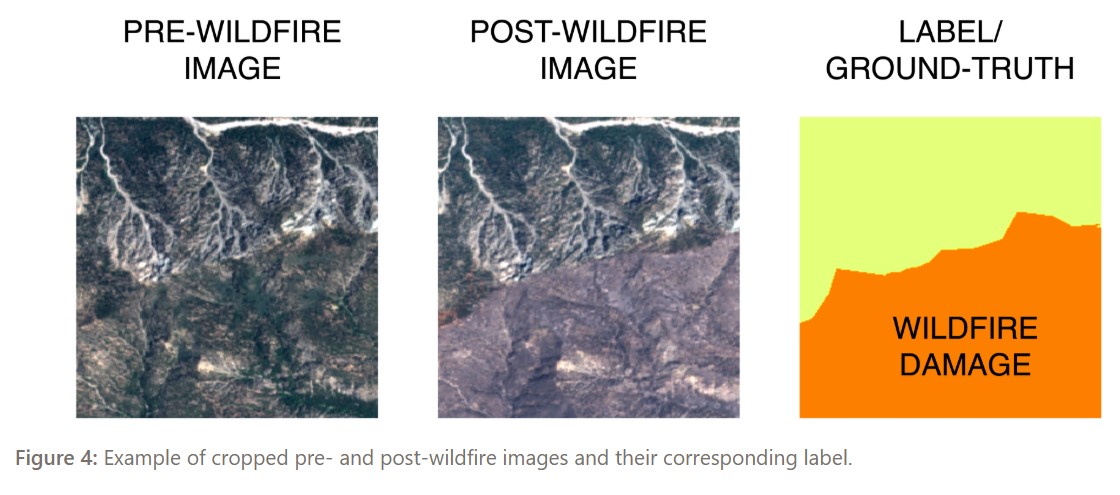
This student research project presents a Python-based approach for detecting wildfires using deep learning and high-resolution satellite imagery. The study introduces the California Wildfire GeoImaging Dataset (CWGID)—a large-scale, bi-temporal collection of over 100,000 labeled “before” and “after” wildfire image pairs. The dataset was created using Sentinel-2 imagery and processed with tools including Google Earth Engine, Rasterio, and GeoPandas. The project demonstrates how pre-trained deep learning models, such as VGG16 and EfficientNet, can be adapted to detect wildfire impacts with accuracies of 76% and 93%, respectively. By outlining a full data pipeline—from image collection and labeling to model training and evaluation—this work showcases the power of Python and open geospatial tools for environmental monitoring and rapid disaster response. This research offers valuable contributions to wildfire detection, geospatial data science, and the broader field of remote sensing for environmental applications.
Mapping History: GIS Documentation of A.M.E. Zion and Magnolia Cemeteries
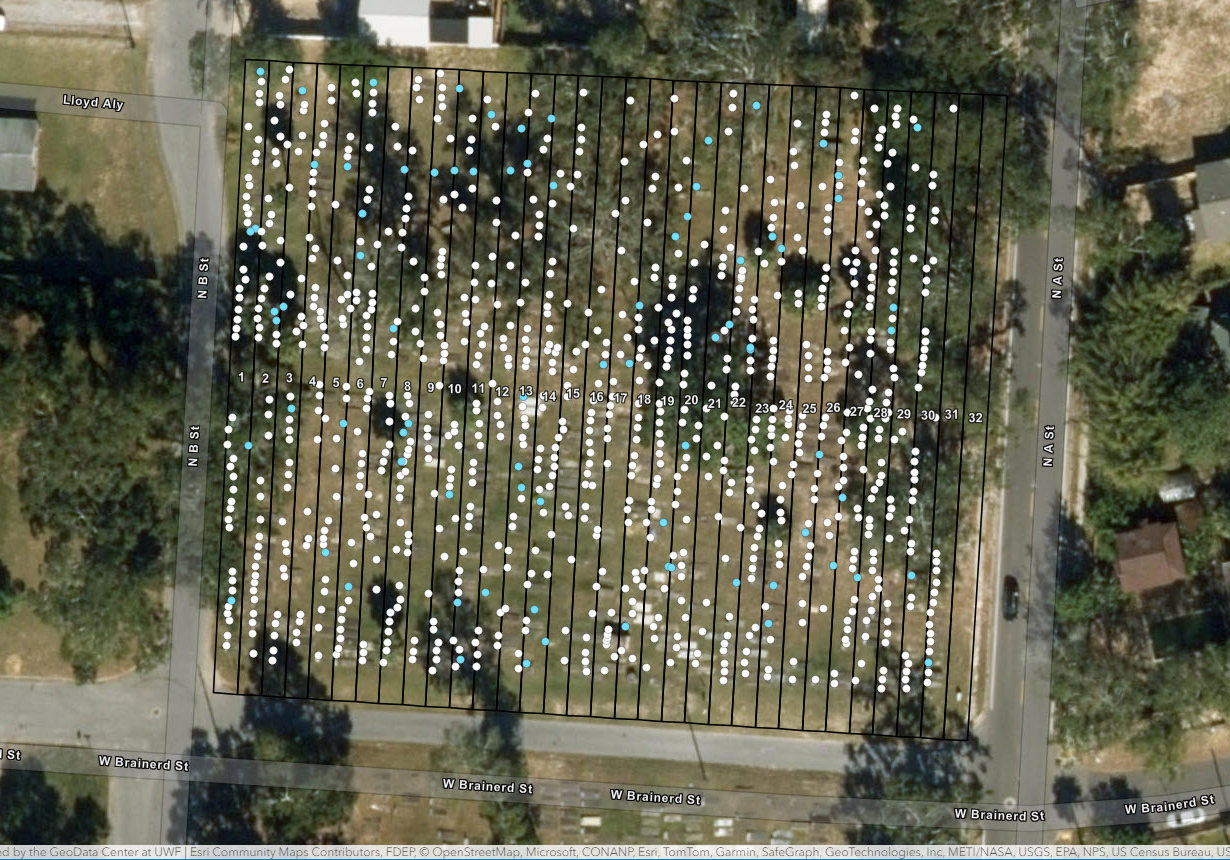
In partnership with the University of West Florida’s Archaeology Institute, the GeoData Center led a GIS mapping project to document and preserve two historic African American cemeteries near downtown Pensacola—A.M.E. Zion and Magnolia. These cemeteries, recently revitalized through community cleanup efforts, are culturally significant for their vernacular headstones, war veterans, and notable community figures. The GeoData Center developed a custom GIS solution using ArcGIS Online and high-accuracy GPS to map over 2,000 gravesites. Each site was recorded with detailed structural attributes, headstone information, and photographs to support long-term preservation, research, and cultural appreciation. This project reflects the vital role of geospatial tools in historic preservation and community heritage documentation.
Student Capstone Project: Visualizing Compliance: GIS Dashboard for Florida’s NPDES Stormwater Program
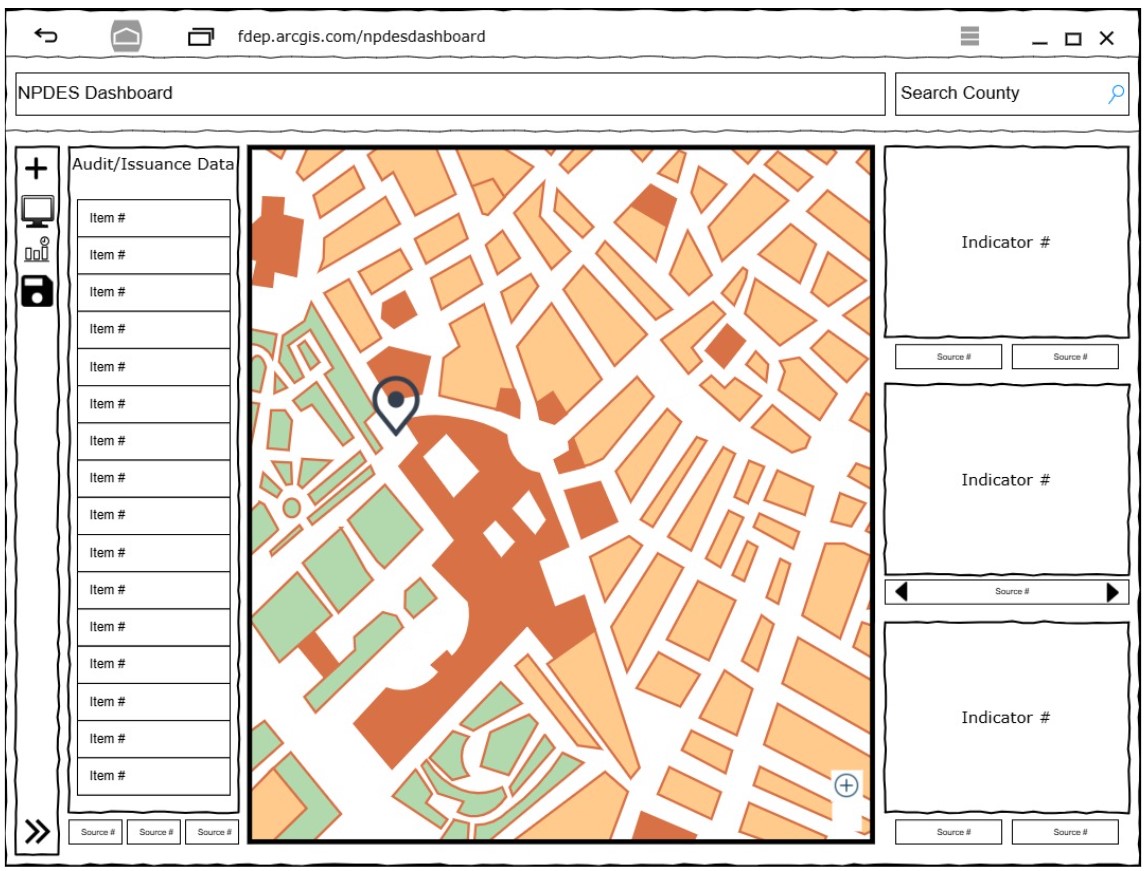
This project focuses on developing a GIS-based dashboard for the Florida Department of Environmental Protection’s (FDEP) National Pollutant Discharge Elimination System (NPDES) Stormwater Program. With vast data stored in the Wastewater Facility Regulation (WAFR) database, the program needed a more visual and accessible way to monitor permit compliance and facility locations. Using ArcGIS Online and authoritative spatial data maintained within the department’s Spatial Database Engine, this dashboard delivers real-time insights into permit status, noncompliance issues, and the spatial distribution of regulated facilities. The system is designed to update nightly and comply with internal IT and access standards. The dashboard provides NPDES staff and managers with a powerful tool to quickly assess program performance, identify problem areas, and support informed decision-making. By transforming raw data into interactive maps and visuals, the solution enhances transparency, efficiency, and communication across internal teams and with external stakeholders.
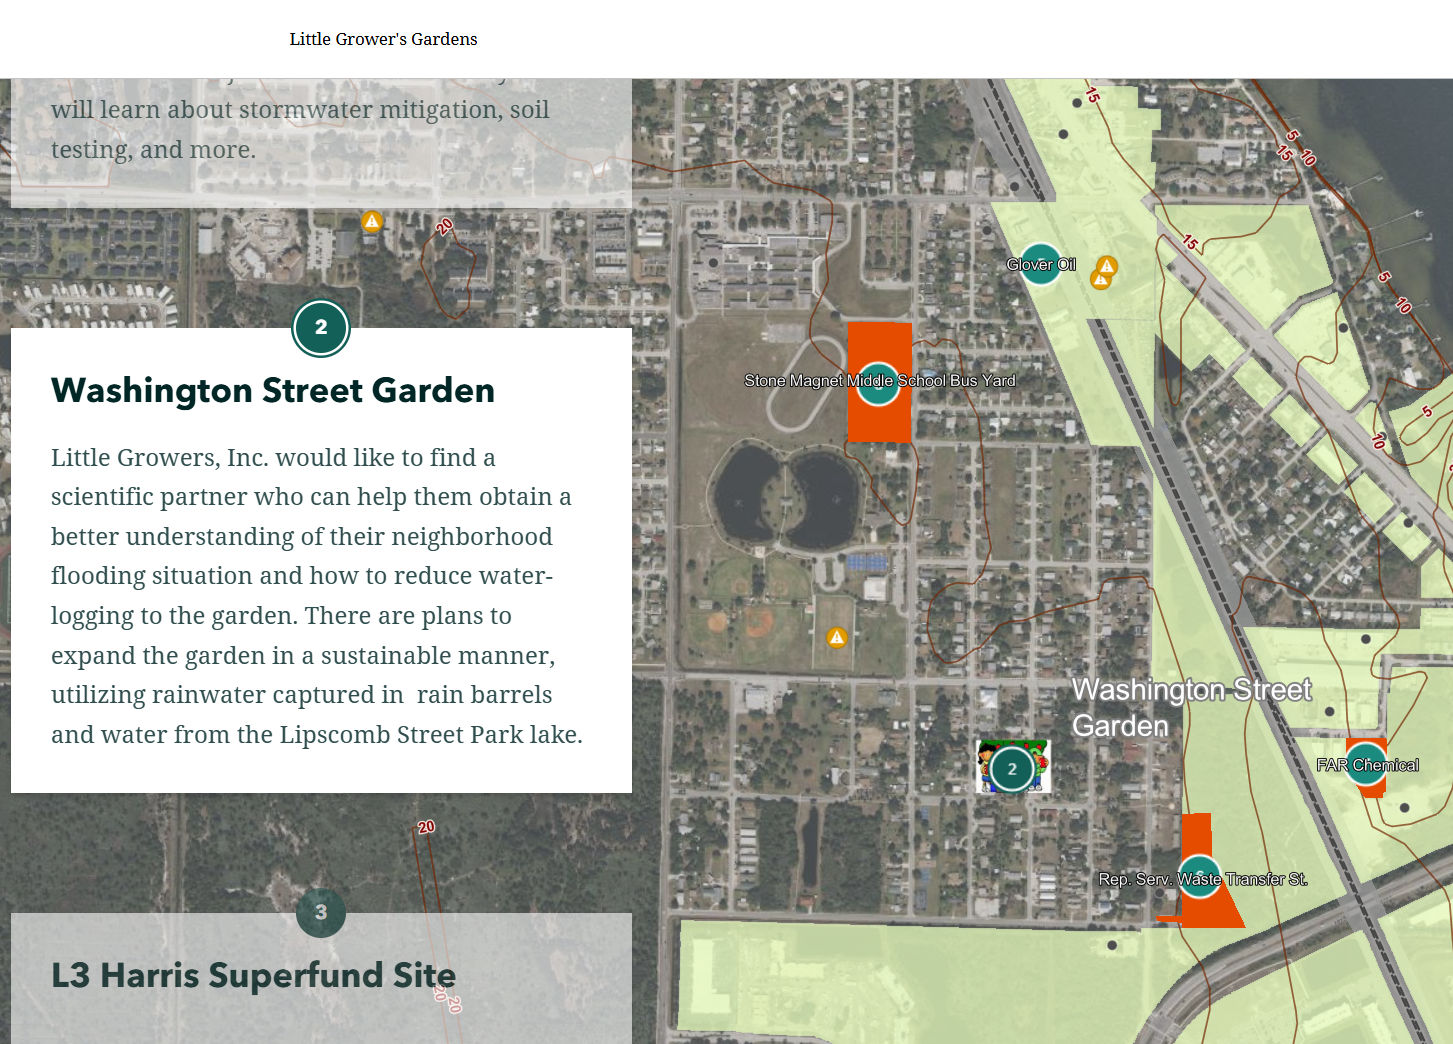
Little Growers' Gardens – Community Resilience Through Urban Agriculture
The community-driven Little Grower's Gardens project, facilitated by the Thriving Earth Exchange in partnership with Little Growers, Inc. and the GeoData Center, evaluated potential environmental health risks near proposed urban garden sites. Through hands-on garden-based learning and GIS storytelling, it highlights how local youth are empowered to build food security, sustainable practices, and environmental awareness. Key objectives included identifying nearby sites of contamination concern, researching their current environmental status, and assessing potential pollutants and sensitive receptors—such as schools, homes, and the garden sites themselves. Six local facilities were ultimately examined for their potential to affect the garden areas. The findings will help inform safe land use, guide future mitigation strategies, and support environmental justice efforts in the community. This work highlights the power of collaborative science to address local challenges related to natural resources, health, and land use planning.

Student Capstone Project: Tracking the LaPorte County Railroads: Valuation Maps and More
This project modernizes access to historic railroad valuation maps from the LaPorte County Surveyor’s Office by converting paper records into a searchable, user-friendly web map. Designed to save time for land surveyors and reduce staff workload, the map allows users to explore railroad segments, view associated documents, and download files directly from linked cloud folders. Developed by a professional land surveyor with firsthand knowledge of the research challenges, this GIS application streamlines the process of locating and downloading railroad documentation. Users can explore the map by location or filter by railroad name to access linked folders containing digitized valuation maps and supporting materials. Pop-up windows provide direct access to cloud-hosted documents maintained by the Surveyor’s Office.
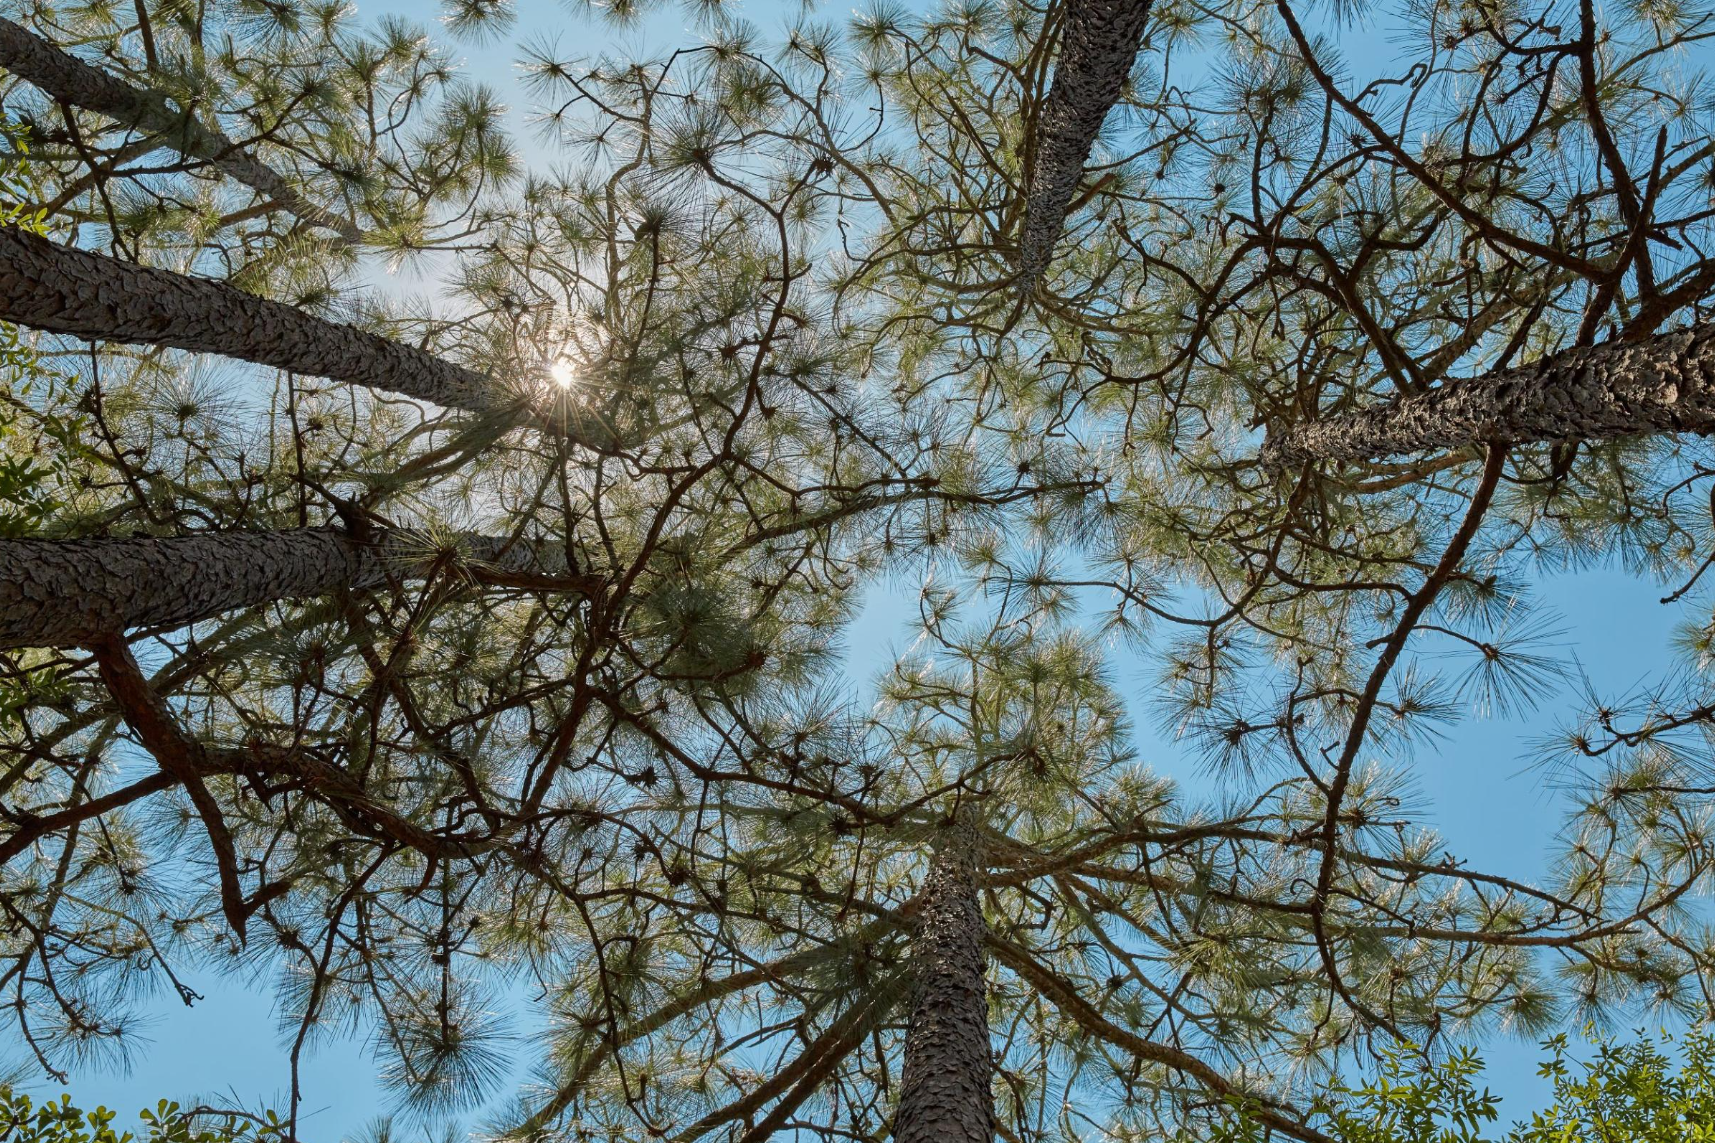
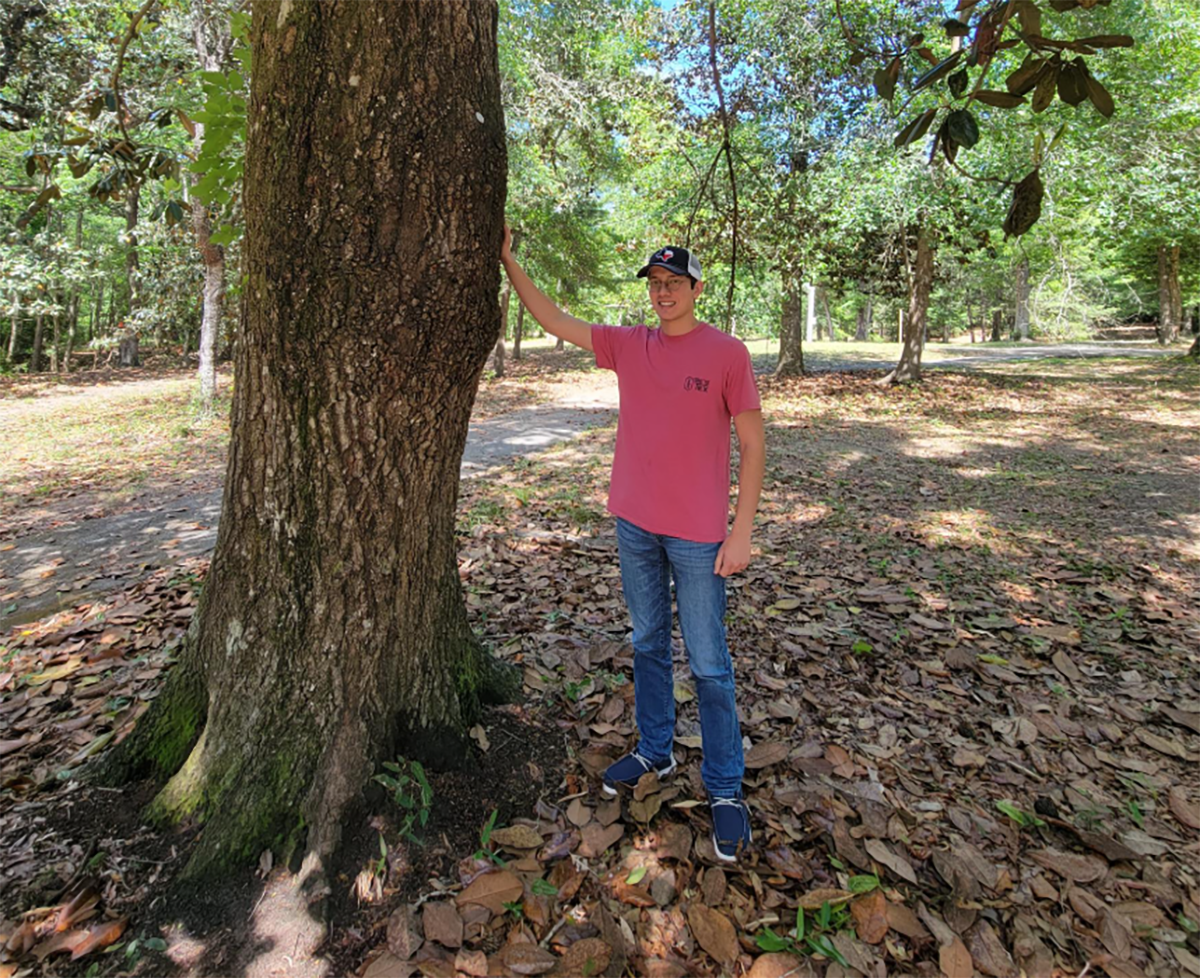
UWF Longleaf Forest Project: GIS Mapping & Ecosystem Monitoring
The UWF Longleaf Forest Project applies geospatial methods to support the restoration and long-term management of the native longleaf pine ecosystem on UWF’s Pensacola campus. Led by Amber Bloechle and Dr. Morgan in collaboration with UWF’s Conservation Program, GIS students conducted a detailed land use/land cover (LULC) classification of West Campus using high-resolution aerial imagery and supervised classification techniques in ArcGIS Pro. Field-based plant species mapping was also performed to identify vegetative patterns and inform future conservation treatments. Collected spatial data was compiled into a web-based StoryMap to communicate findings and track progress. Feature layers include prescribed burn plots, trail networks, and habitat areas targeted for restoration. Students also developed a foundational geodatabase to support long-term monitoring and enable integration with future datasets, including burn history, species diversity, and student-led field observations. These GIS deliverables support UWF’s broader Living Lab initiative, transforming campus natural spaces into active learning environments for research, teaching and ecological stewardship.

Student Captone Project: Developing a CMMS for Recreational Signage on SWFWMD Public Lands
This project, conducted in partnership with the Southwest Florida Water Management District (SWFWMD), focused on building a Computerized Maintenance Management System (CMMS) to inventory, assess, and manage recreational signage across District-owned and co-managed public lands. These signs, critical for wayfinding, public outreach, and education, often suffer from wear, vandalism, or storm damage—especially in remote areas where maintenance challenges are magnified. Using high-accuracy GPS tools (Trimble R1 and GNSS Status) and a custom Survey123 form, GIS data was collected from 69 recreation sites and 134 public access points. Each sign was recorded with condition details, GPS coordinates, and supporting photos. The collected data feeds into a GIS-driven CMMS hosted through ArcGIS Online, allowing SWFWMD staff to visualize signage conditions, track maintenance needs, and streamline future updates. The resulting dashboards, maps, and data layers provide long-term benefits across multiple departments, improving public engagement and optimizing resource use as Florida’s recreational lands see growing demand.
Santa Rosa County Resilience to Future Flooding Grant (Phase 1)
Led by the GeoData Center in partnership with local officials and stakeholders, the Santa Rosa County Resilience to Future Flooding project focuses on identifying priority assets and community values through public engagement and spatial analysis. Using GIS tools and best practices from the Florida Department of Environmental Protection’s Resilient Florida Program, the assessment sets the foundation for long-term strategies to address climate change impacts, sea level rise, and future coastal hazards. This project involved the development of a spatial vulnerability model to identify flood-prone areas within Santa Rosa County using ArcGIS tools and multi-criteria decision analysis. Project results are being applied by county planners to inform adaptation strategies, support nature-based infrastructure projects, and pursue funding for future flood mitigation efforts.
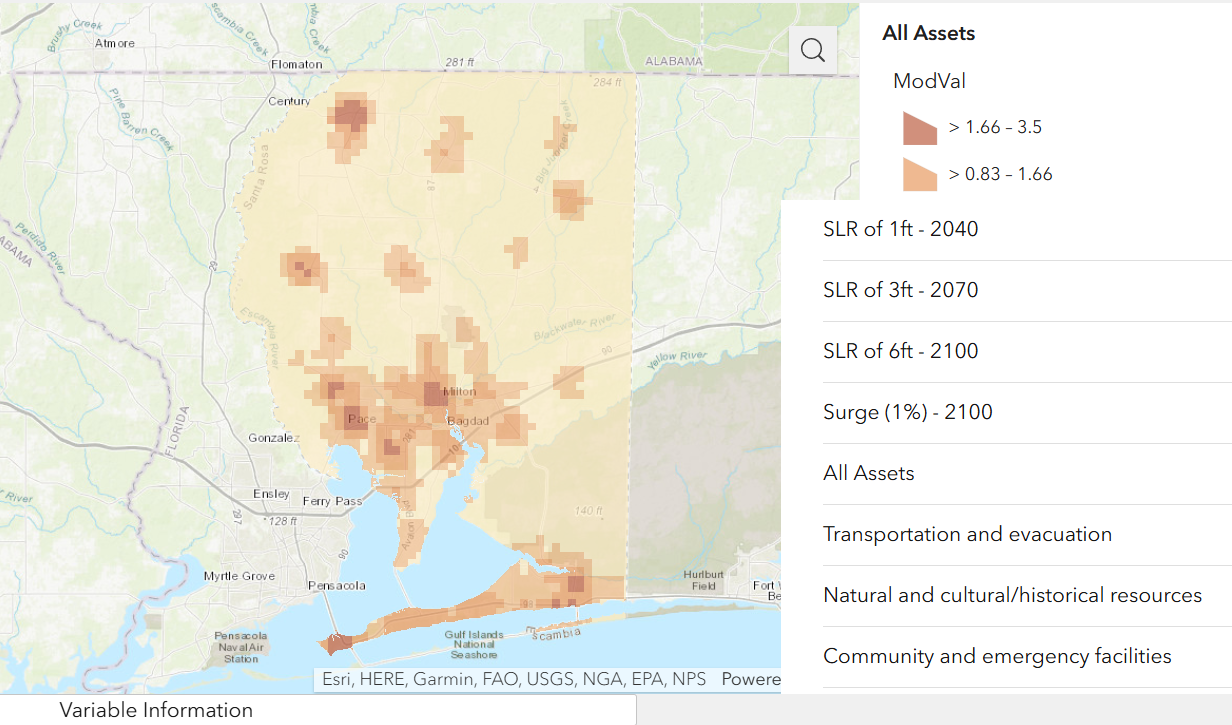
Santa Rosa County SLR Vulnerability Assessment (Phase 2)
The Santa Rosa County SLR Vulnerability Assessment story map presents the findings of a comprehensive sea level rise vulnerability assessment conducted for Santa Rosa County, Florida. Developed by the GeoData Center in collaboration with county stakeholders, the presentation integrates GIS-based analysis, local infrastructure data, and NOAA sea level rise scenarios to identify areas at greatest risk. The tool helps inform planning decisions, increase community resilience, and support coastal adaptation efforts through clear, accessible visualizations and data-driven insights.
UWF Tree Campus USA GIS Inventory
The UWF Tree Campus USA GIS Inventory project supports the University of West Florida’s participation in the Arbor Day Foundation’s Tree Campus Higher Education program by developing a GIS-based inventory of over 300 trees on the Pensacola campus. Data was collected by a certified arborist and students, then integrated and visualized using ArcGIS Pro and ArcGIS Online. The result is an interactive, editable map that supports sustainable campus forestry management, field data collection with mobile apps, and future planning. This work promotes environmental stewardship, student engagement, and campus operations through the practical application of geospatial technology.
Transboundary Viewshed Changes Post-Hurricane
The Transboundary Viewshed Changes Post-Hurricane project explores the legal, geographic, and economic challenges posed by hurricanes on Florida’s developed coastlines. The project focuses on understanding how natural events influence shoreline structure, access rights, and the economic implications of shifting public-private boundaries. By examining the intersection of environmental change, land use, and legal jurisdiction, this work highlights the growing need to adapt coastal development strategies in the face of increasing storm impacts.

St. Michael's Cemetery GIS
The Saint Michael's Cemetery interactive map allows users to take a virtual tour of the cemetery and view all the grave, marker, botanical, soil, and topographical GIS layers created for the SMC project. Nowhere else in our society are we as cognizant of the cultural landscape of our communities as in our historic cemeteries. Understanding a cemetery’s relationship to the physical and cultural landscape of the early community it served, and in many cases, the modern community it continues to serve enhances our understanding of how our communities were organized and grew. St. Michael's Cemetery, once situated on the outskirts of a colonial town, is today an eight-acre green space in the heart of urban, historic Pensacola, Florida. Like most historic cemeteries, St. Michael’s reflects the social history of the community it is associated with.
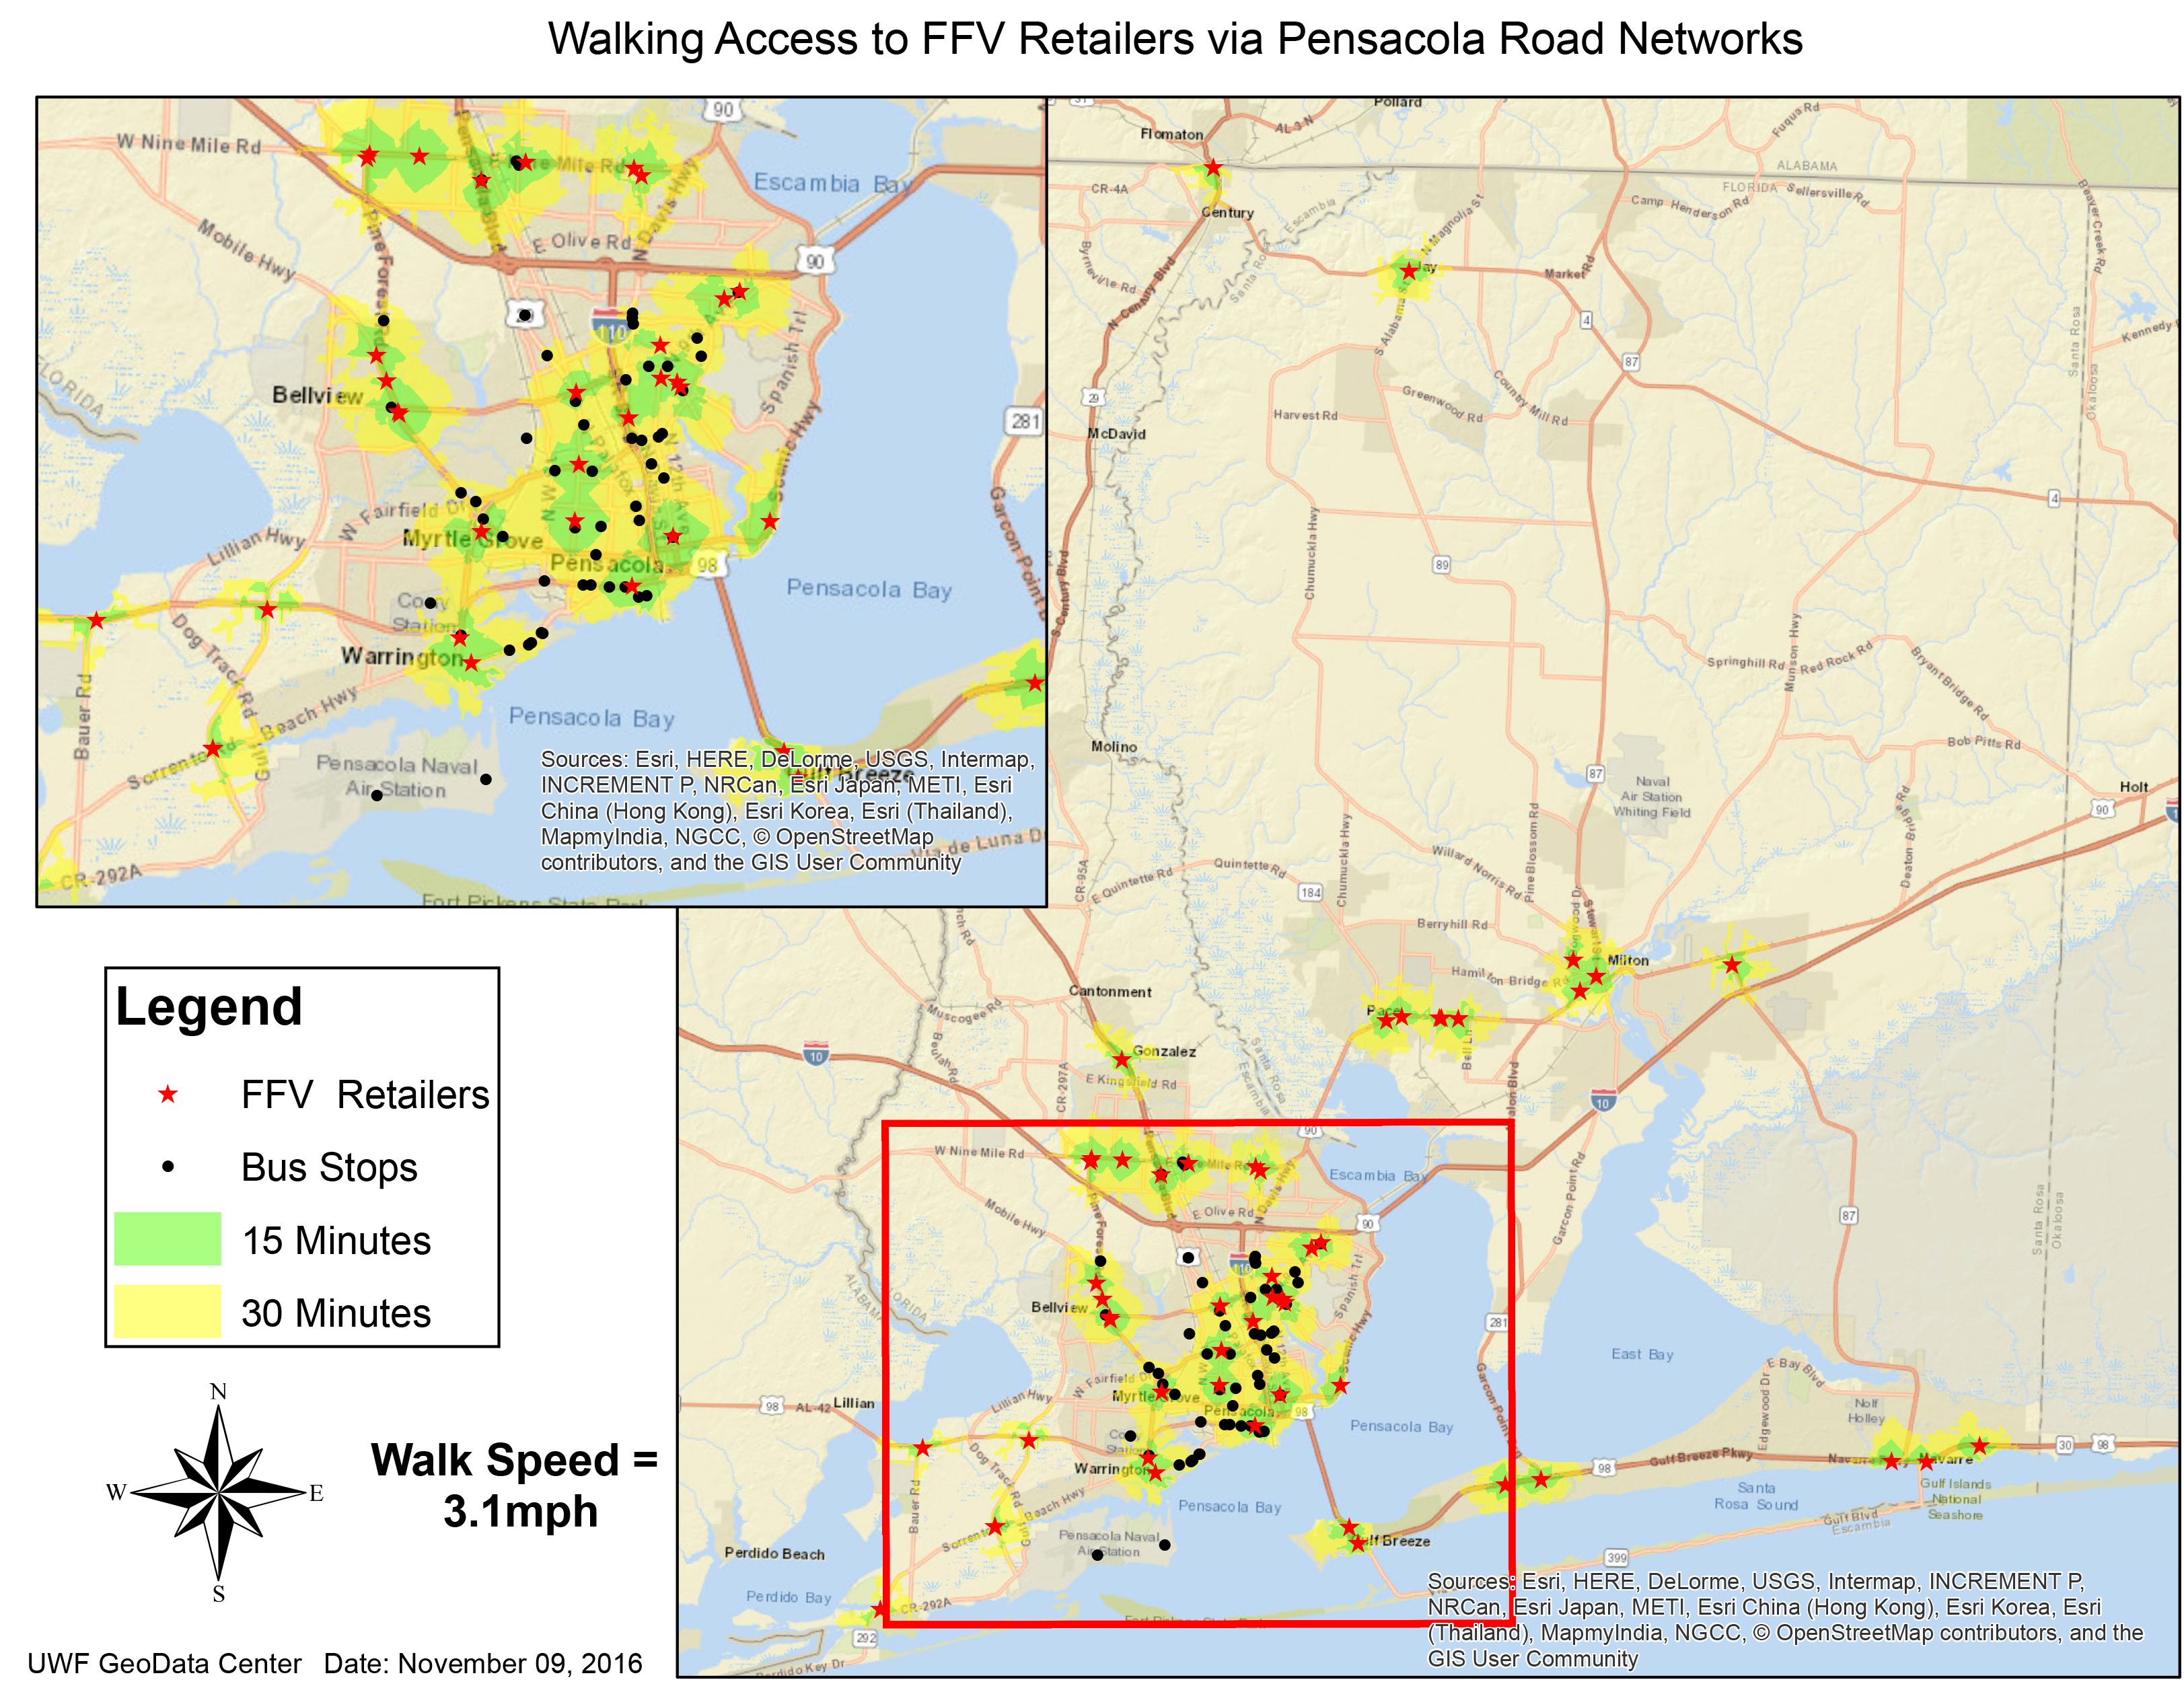
SNAP Food Deserts Escambia and Santa Rosa Counties
Performing network analysis: Using road networks to calculate possible transit distances from a certain point allows users to see the coverage area for any given feature. Range can be a function of distance or time. In this case, we used road networks to investigate equity of healthy food access (grocery stores) by those communities who need it most and may not have a car to travel far distances.
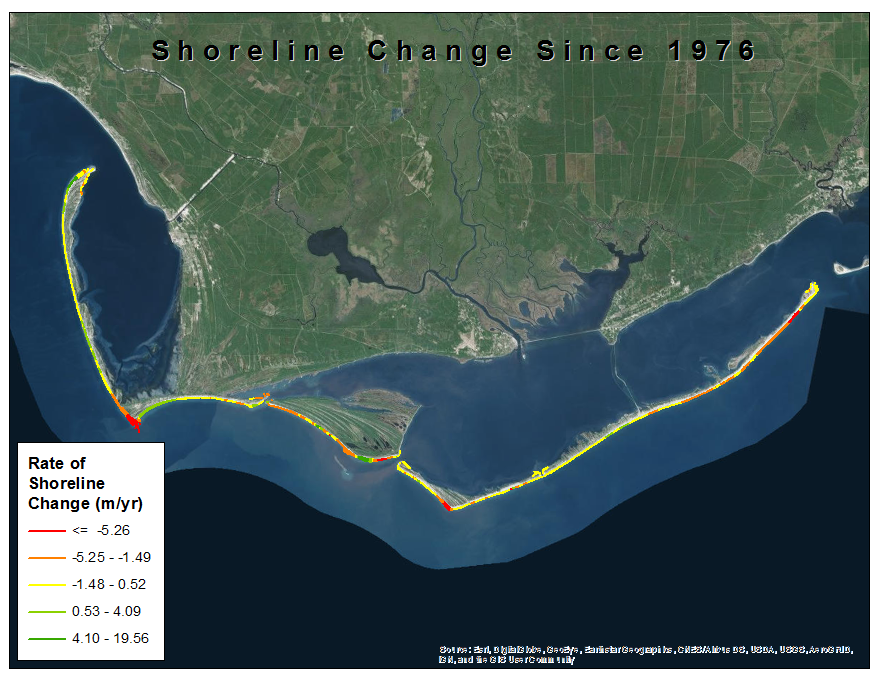
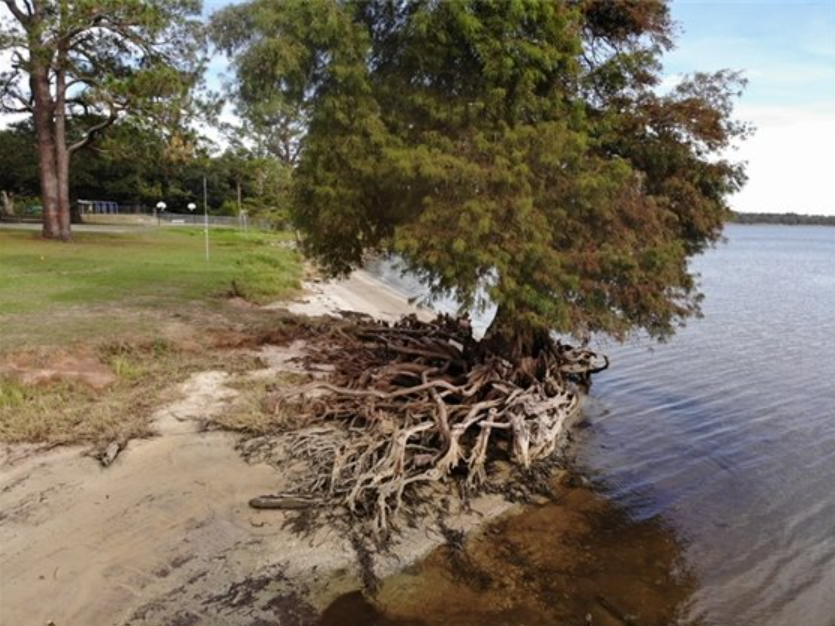
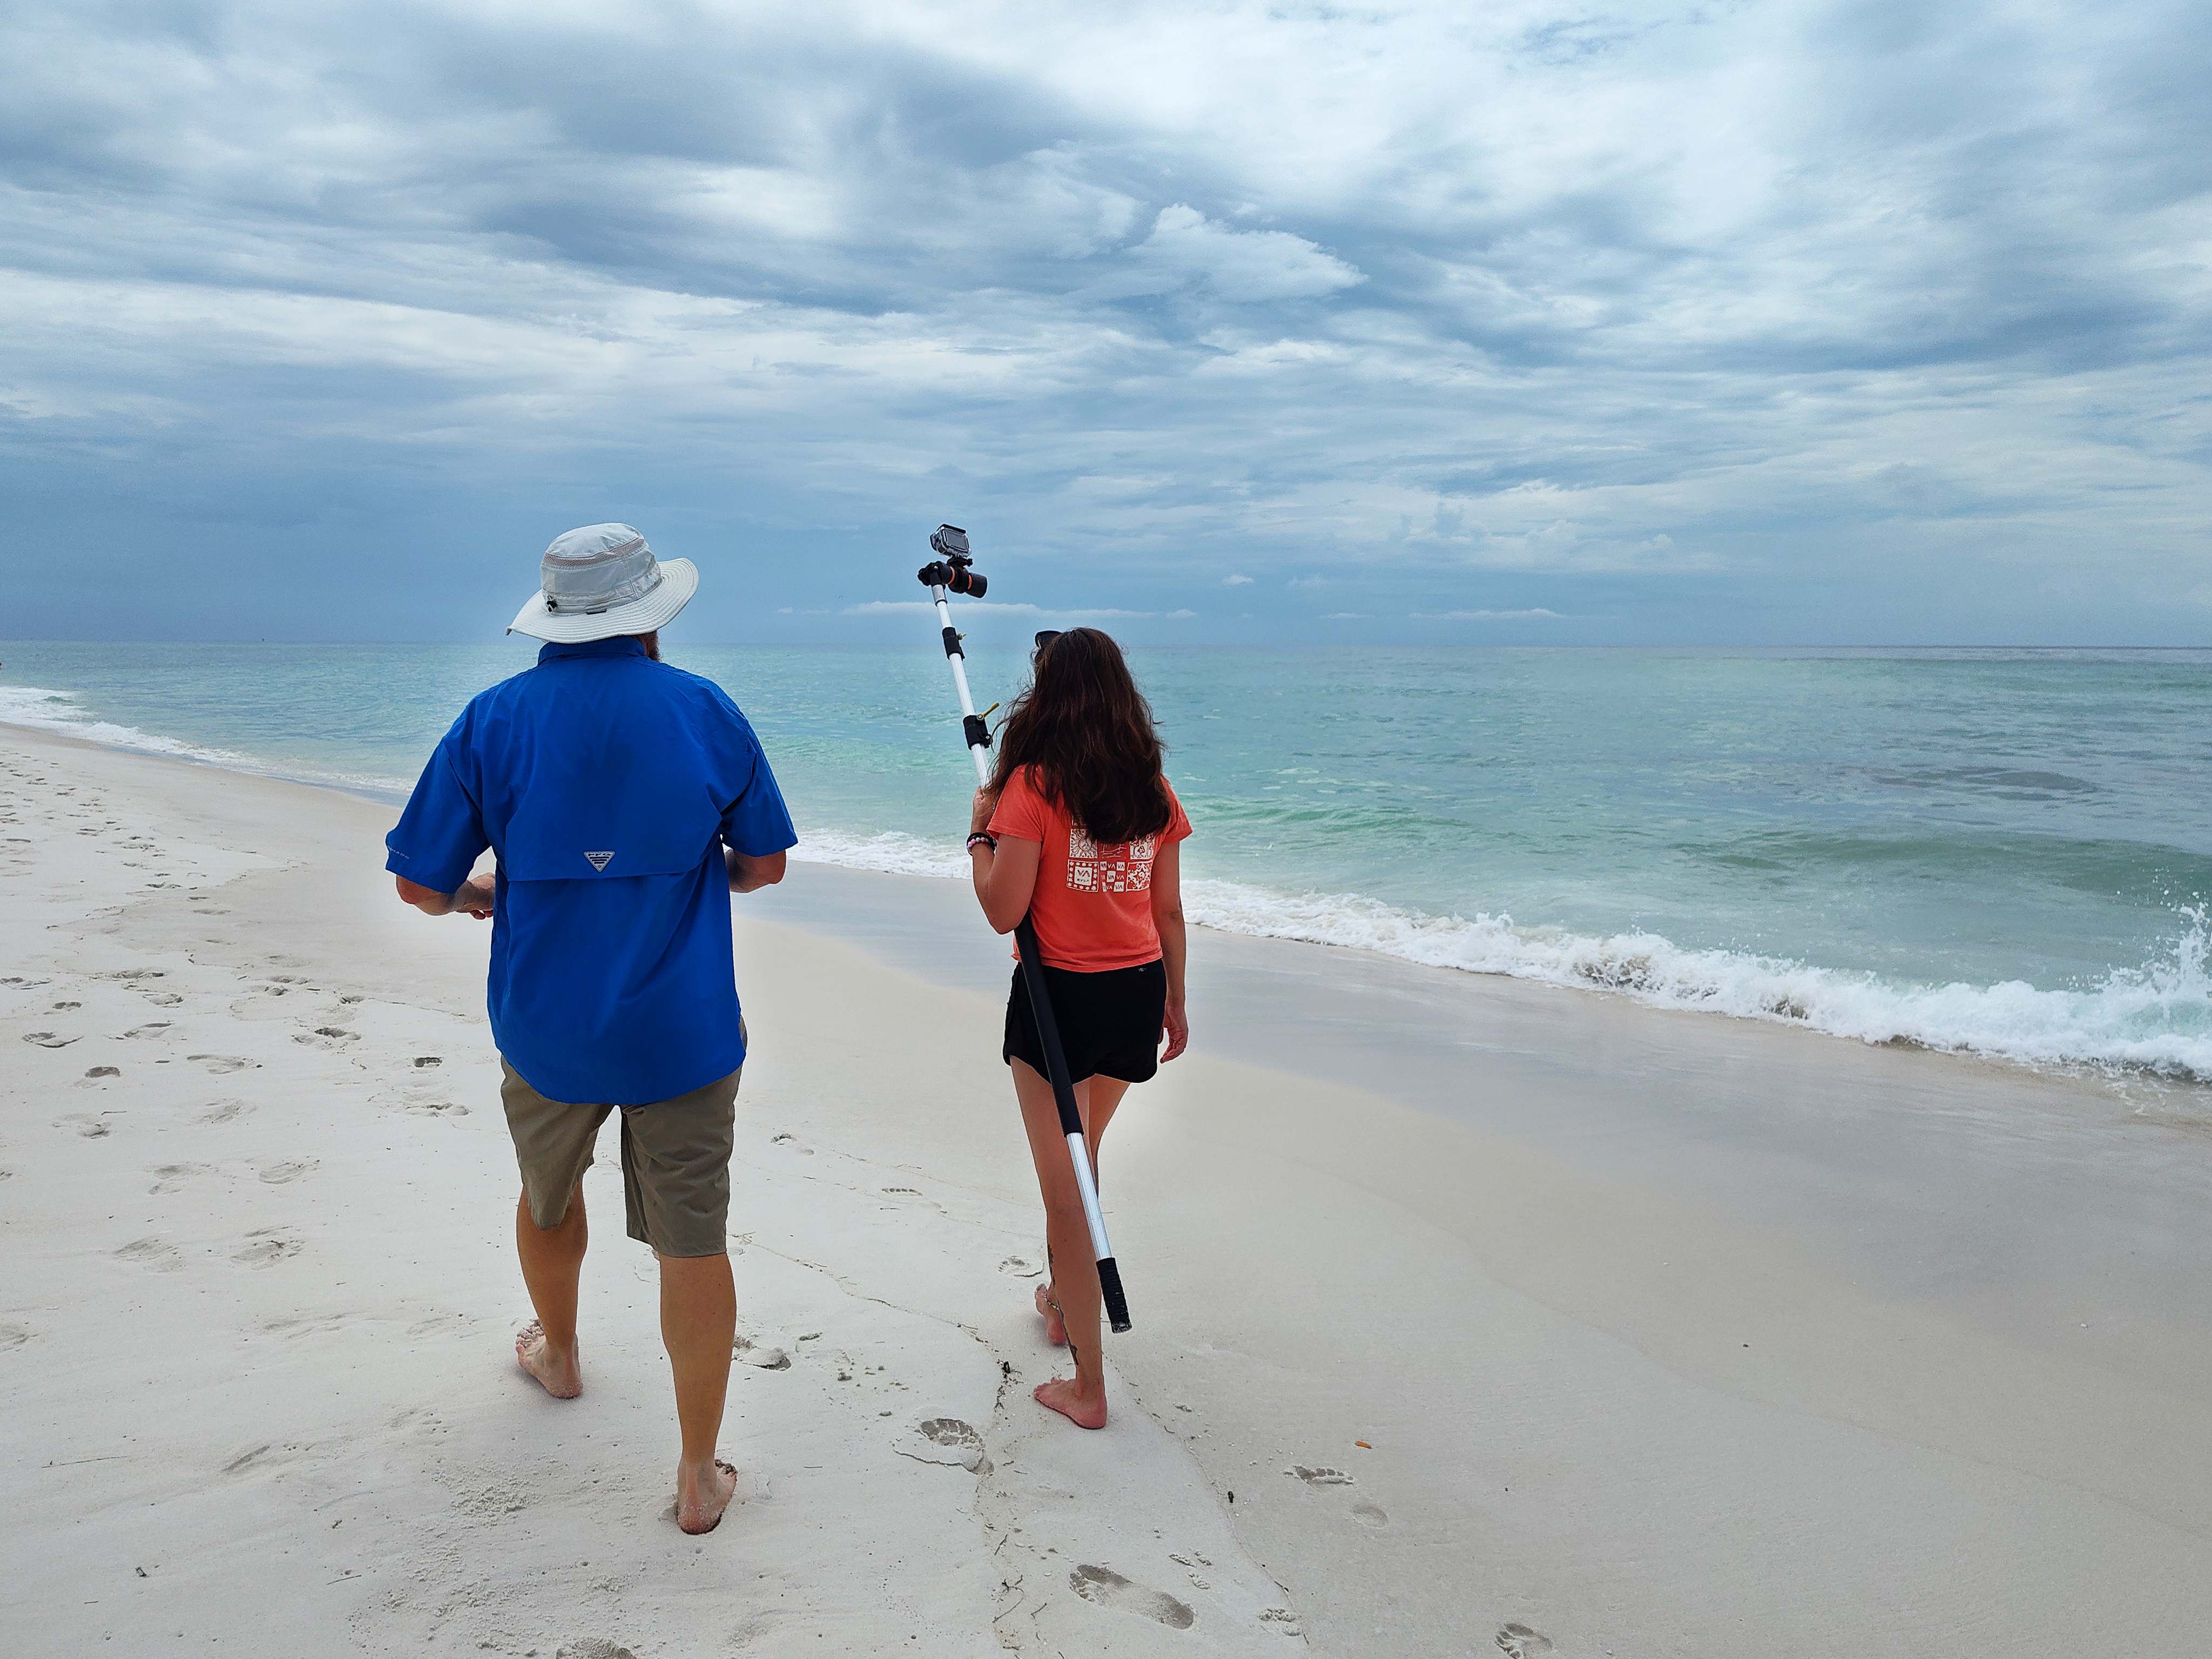
Shoreline Change 1972-Present
Using satellite imagery from 1972 until present, we are able to detect areas along the coast that have suffered the most severe erosion. By delineating the shorelines of each year and using those as the input to the USGS Digital Shoreline Analysis System (DSAS), you can quantifiably and visually highlight areas that have suffered the greatest amount of erosion or deposition.
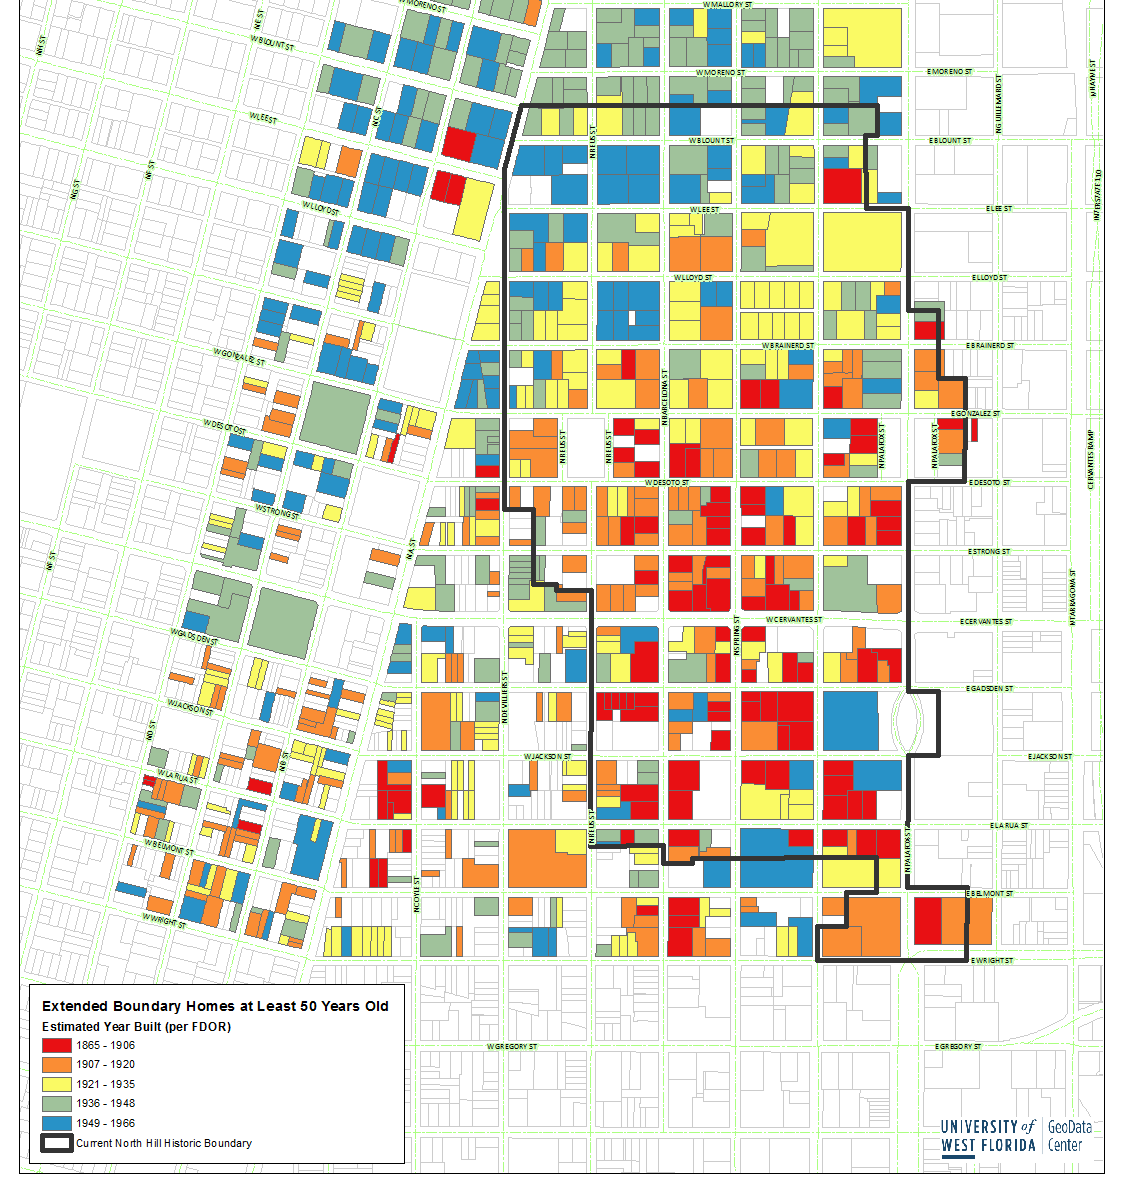
Historic Preservation Home and Boundary Mapping
The North Hill Preservation Association is dedicated to preserving and maintaining the unique and beautiful historic homes, parks, and cemeteries in the North Hill neighborhood near downtown Pensacola, FL. The Geo Data Center at UWF contributes boundary maps and spatial analysis for the current and potentially expanding historic community. The sample shown here uses Florida Department of Revenue property tax data to identify and categorize homes that are at least 50 years old for planning purposes in this historic preservation district.


