NWFL GIS User Group Digital Media Fall 2016
In conjunction with the Northwest Florida GIS User Group, the GIS Online program is proud to host this ongoing online competition showcasing local GIS digital projects.

Chris Mathers & Jennifer Morgan - Bay County GIS
Winner of the Professional Division
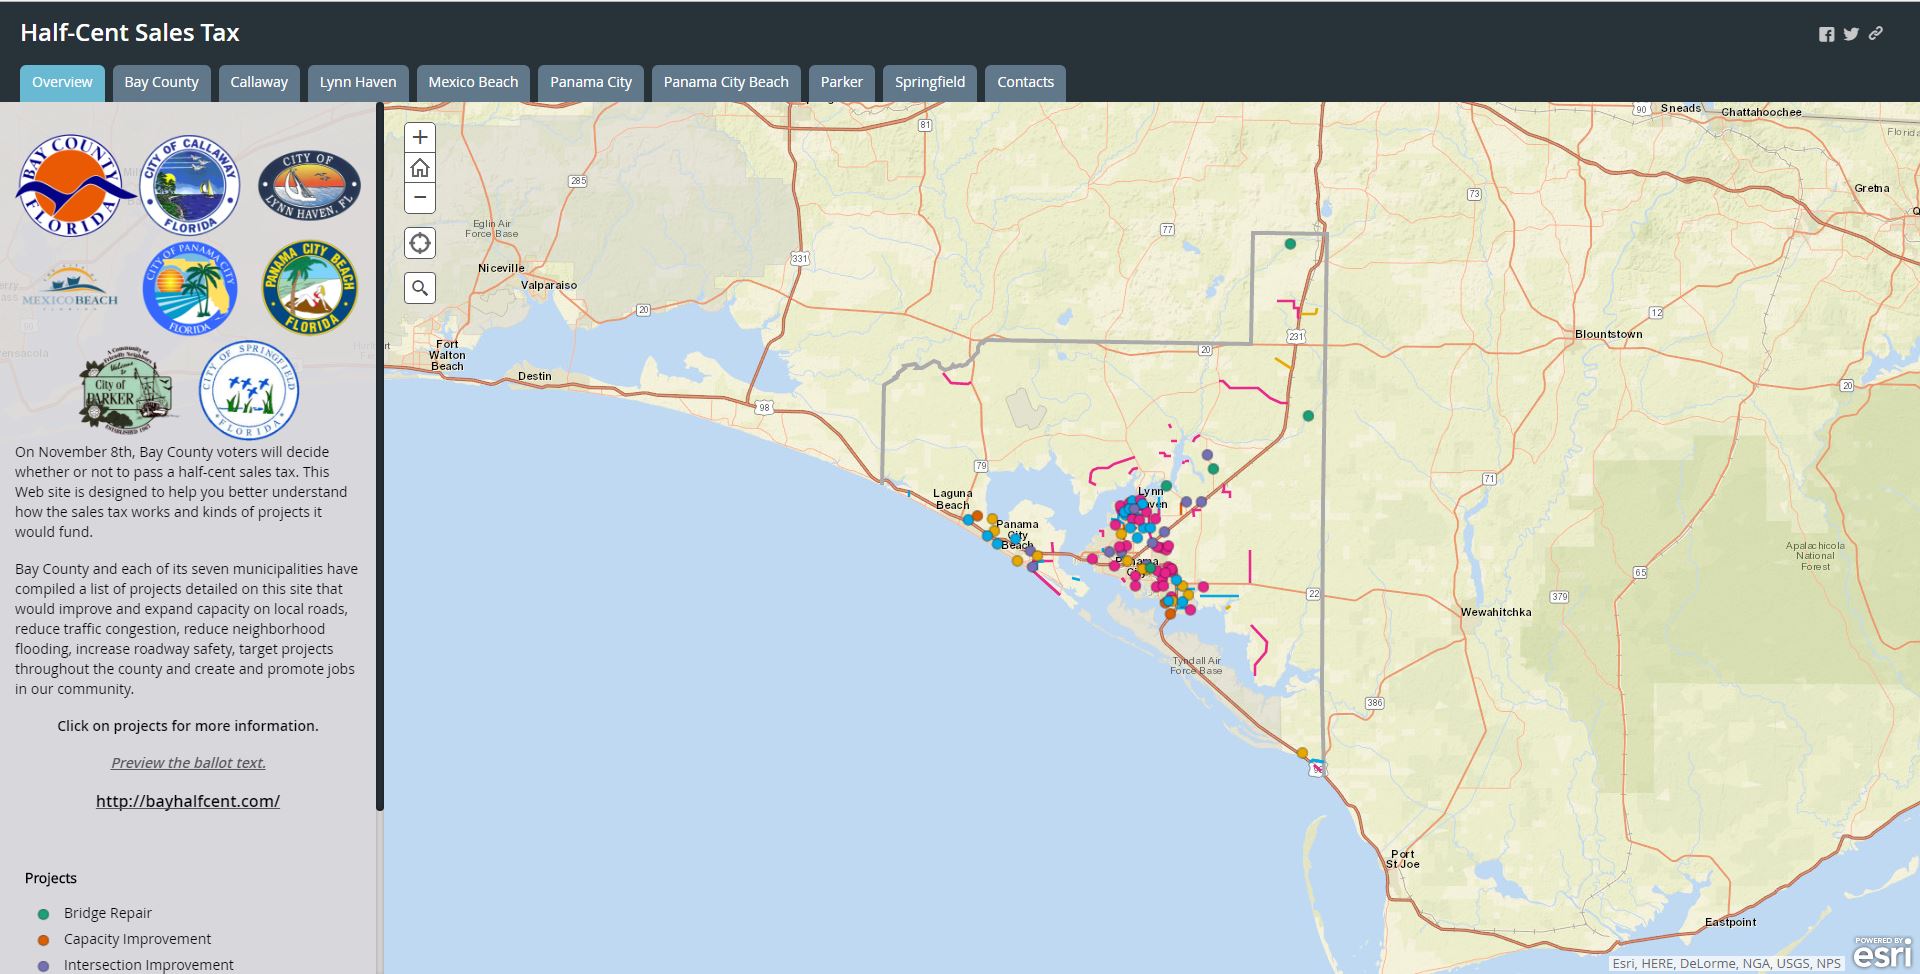
This webmap was developed in support of an information campaign to inform citizens of the kinds of projects that could be completed if Bay County's proposed 1/2 sales tax is adopted.

Maggie Roth - Walton County GIS Intern, UWF Student
Winner of the Student Division
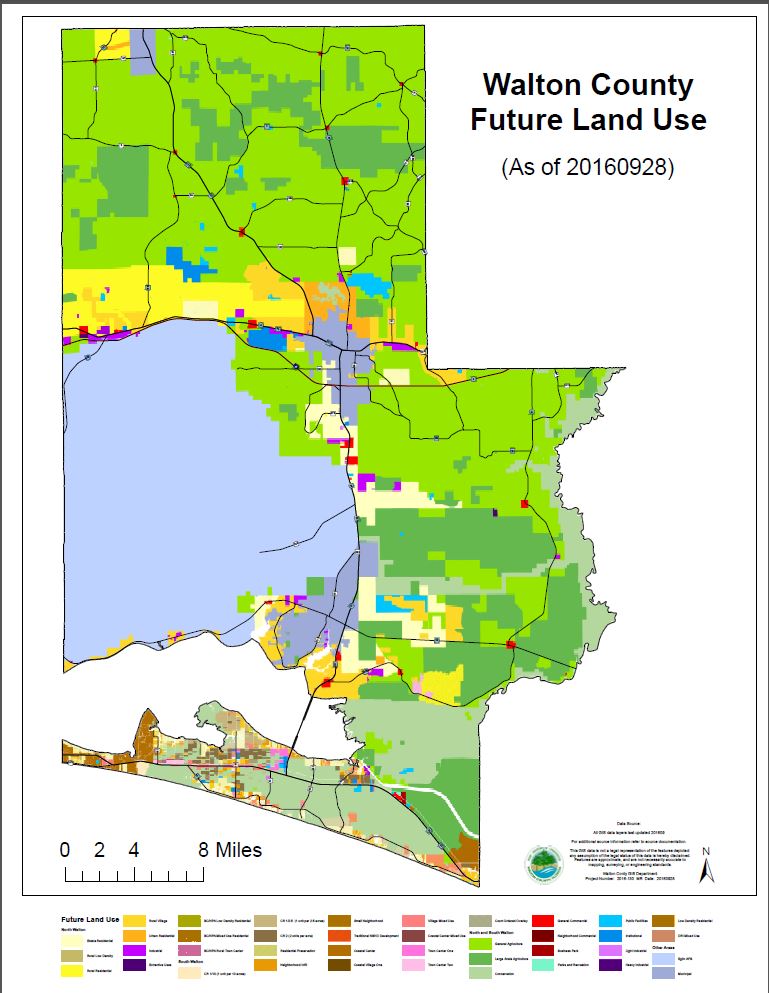
This map displays Walton County’s adopted Future Land Use Designations. This is a spatial visual representation of the land designations throughout the county at this time. The map is subject to change as each land use amendments are incorporated and noted by Ordinance 2011-04 on 03012013. The future land use category boundaries are considered to be approximate and further research may be required to draw accurate conclusions. Please note some designations are specific to certain sections of the county and are identified in the legend.
Maggie Roth - Walton County Future Land Use

James Ireland - Escambia County Emergency Management
This is a map used during the 2016 Blue Angel Airshow Map of Pensacola Beach.

Darliene Stanhope - Santa Rosa County
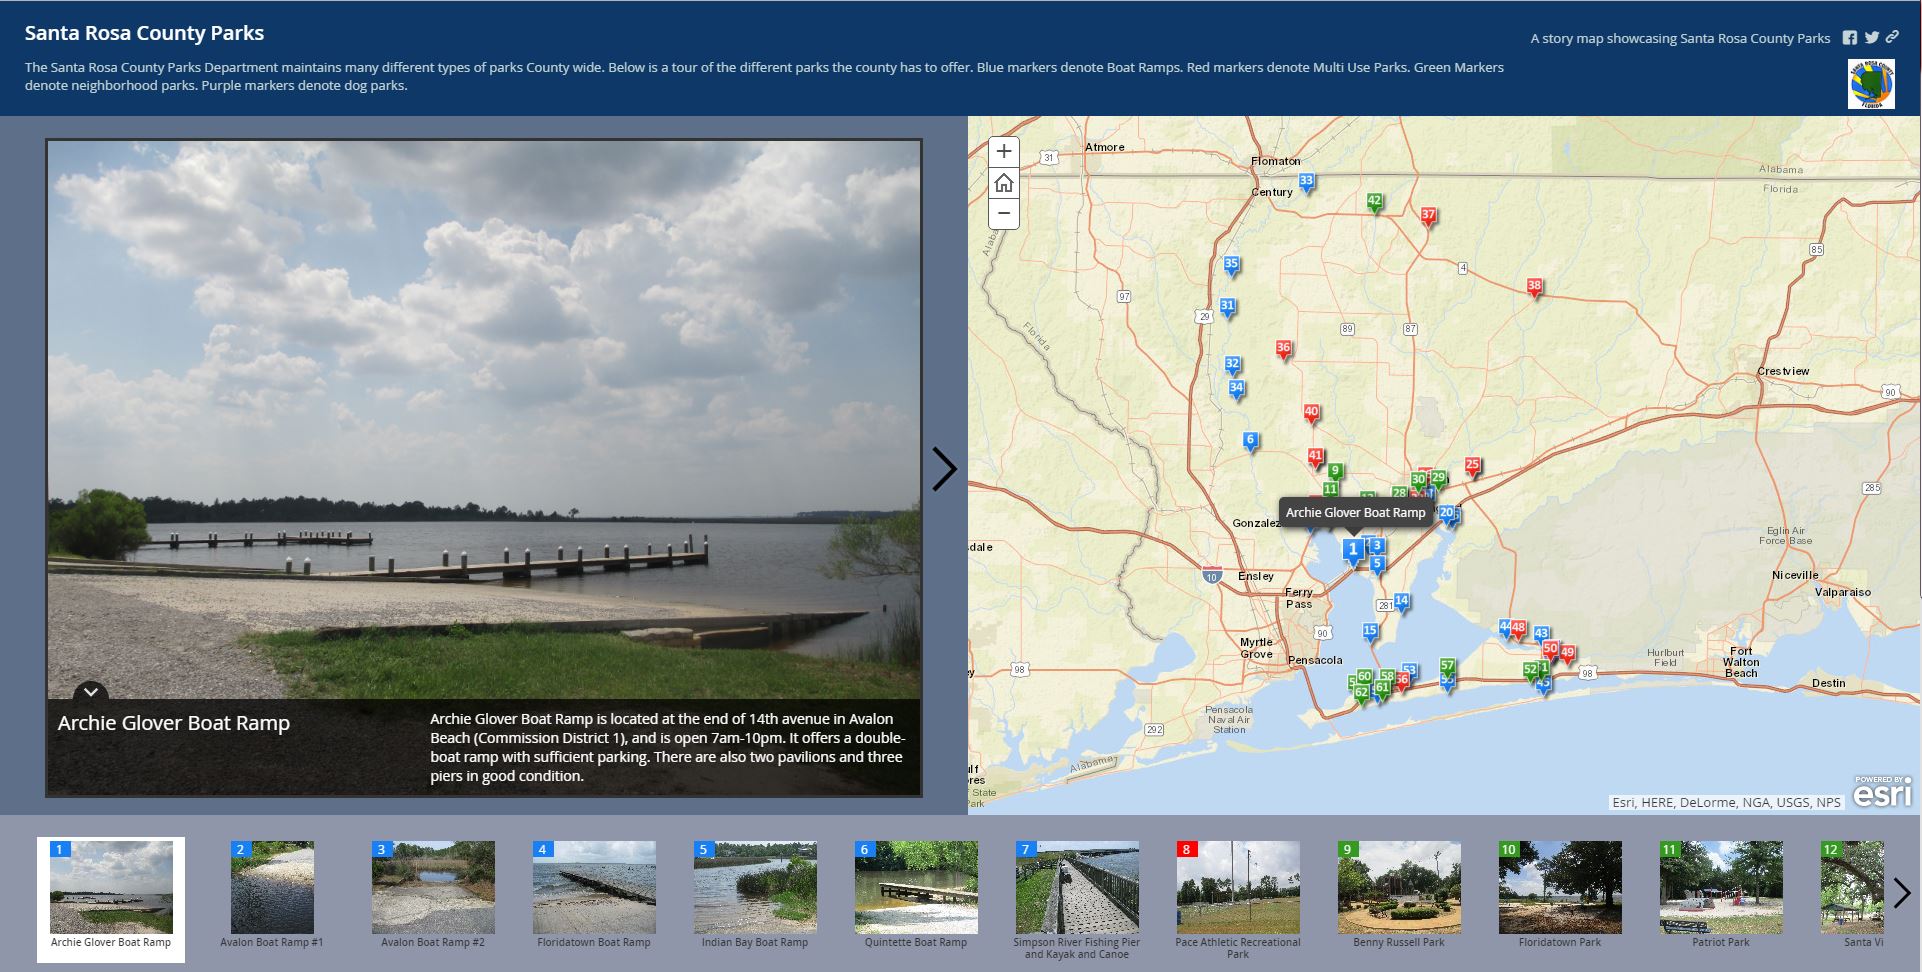
This is a Story Map of Santa Rosa County Parks. It showcases the many different parks located within Santa Rosa County with all of the different amenities. Santa Rosa County has many different parks that appeal to the varied interests of its citizenry.

Florida Resources and Environmental Analysis Center (FREAC), FSU
Team members include: Georgianna Strode, Marjorie Jerez, Tyler McAlear, Benjamin Thornton, and Brittney Gress
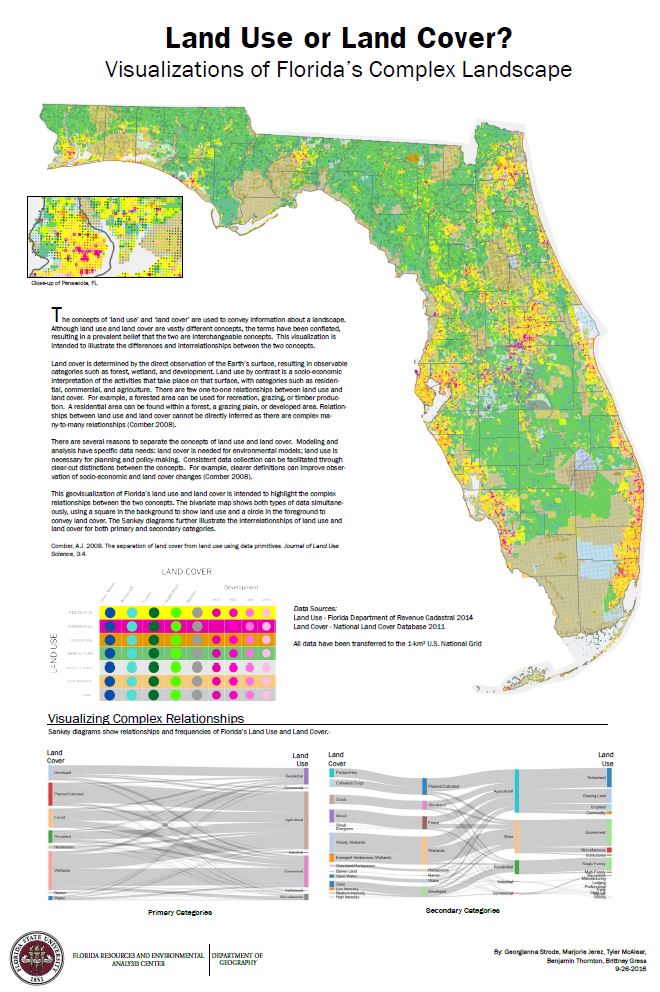
The concepts of ‘land use’ and ‘land cover’ are used to convey information about a landscape. Although land use and land cover are vastly different concepts, the terms have been conflated, resulting in a prevalent belief that the two are interchangeable concepts. This visualization is intended to illustrate the differences and interrelationships between the two concepts.This geovisualization of Florida’s land use and land cover is intended to highlight the complex relationships between the two concepts. The bivariate map shows both types of data simultaneously, using a square in the background to show land use and a circle in the foreground to convey land cover. The Sankey diagrams further illustrate the interrelationships of land use and land cover for both primary and secondary categories.


